TL;DR: wrote my first fabric notebook at work ( download some BOM data) and for some reason, I did find that working first in my laptop using VS code then deploying later in Fabric seemed a more natural workflow to me, maybe working with PowerBI desktop for years has something to do with it, you can download the notebook here
You can just use pure Python in Fabric Notebook.
Fabric Notebook support Pyspark and R but vanilla Python works just fine, the only big limitation writing to Delta is currently in developpement , but there is a workaround, I created a function that try first to write using Spark, if not available it will write using Delta Python which works fine in my laptop, in that case the code will works in Fabric Notebook without any modification

Why Not PySpark ?
Obviously if you have Pyspark installed in your laptop and you are familiar with the syntax then go for it, you can even make the argument it is a long term career advantage to be skilful in it, the catch is, I don’t see how I can install it in my laptop and to be honest, I feel DuckDB or pandas for that matter is substantially friendlier to use.
Python is very good to download public Data
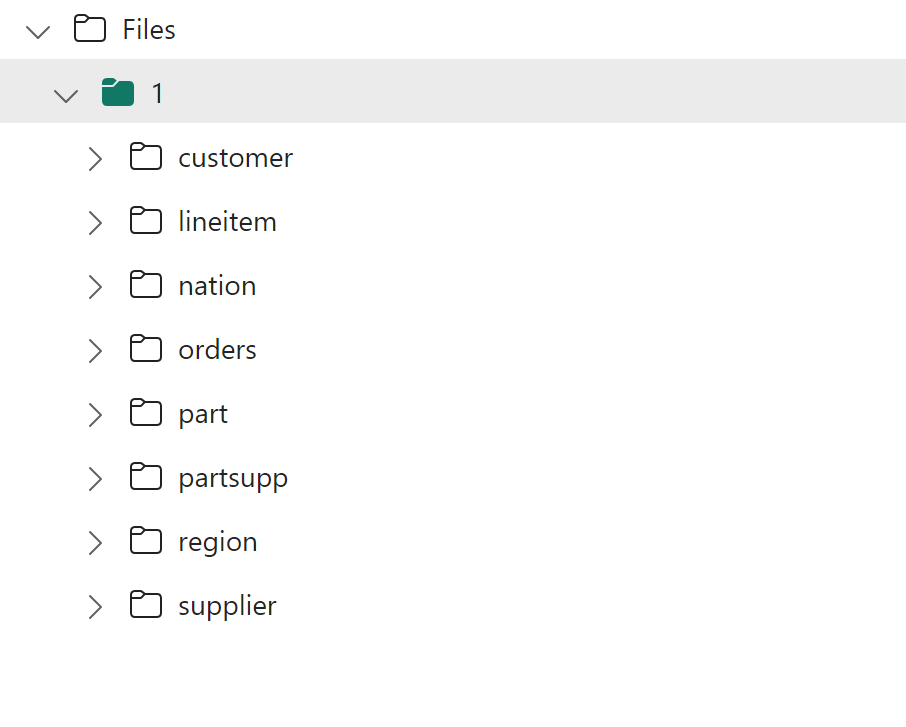
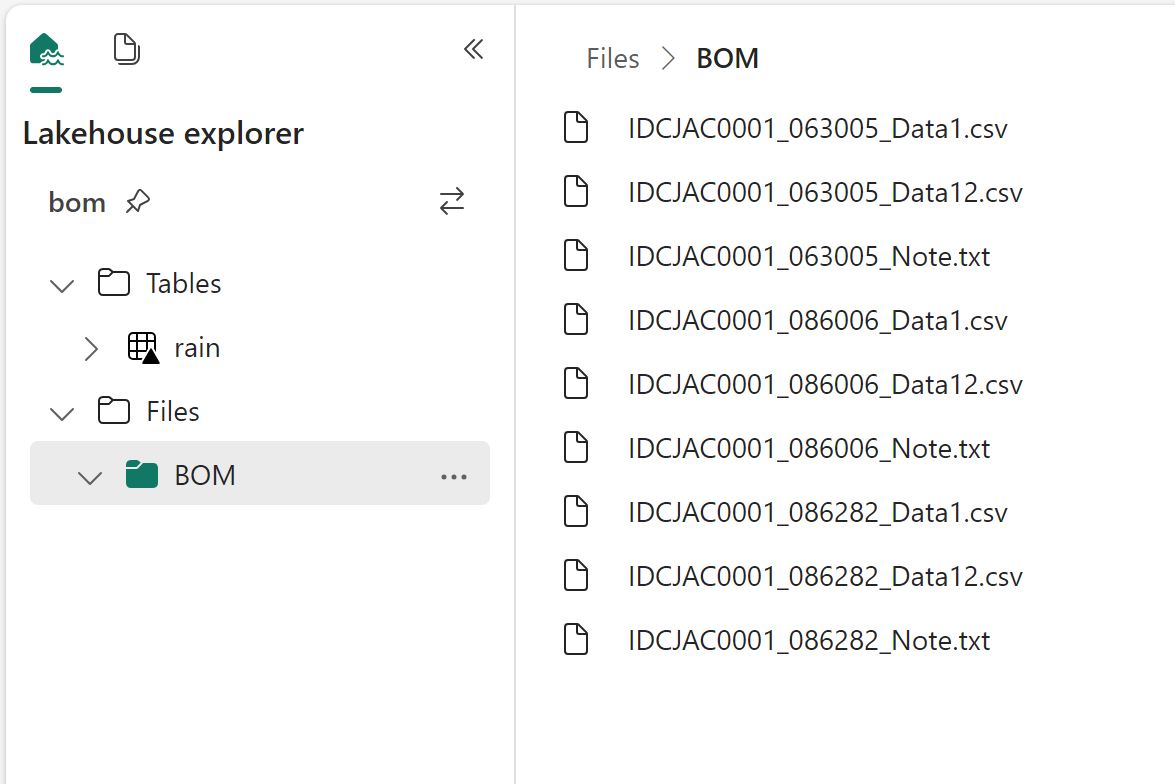
I use a Python function to download data from BOM website to csv files in a local folder, I copied the same Folder Path as Fabric Lakehouse

I hope the code keeps working, I justed copied some code from the internet and mess with it till it worked, I have no idea how regex is working, and I don’t even want to know
DuckDI API has a vibe of PowerQuery
I used DuckDB to clean the data, you can use Pandas, Polars, Ibis or any library that you like, personally I never liked CTE in SQL, I much prefer step by step logic and seeing the results in every step, and this is exactly what I am doing here
Read everything as a text

Normalize_names will replace empty space with an underscore
All_varchar , will read everything as a text, you can cast the correct type later
DuckDB uses lazy evaluation by default, you need to use show() to see the result
Unpivot Other Columns
Unpivot other columns is one of the coolest feature of PoweQuery, DuckDB has a very nice SQL syntax to do the same

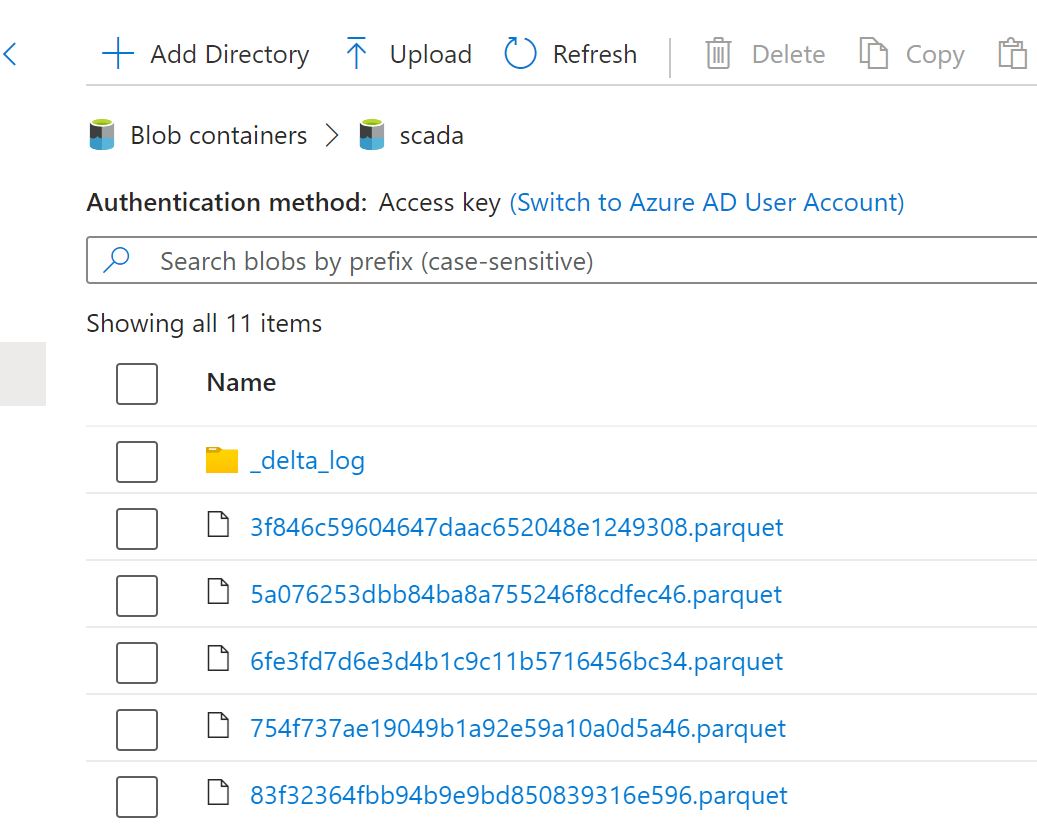
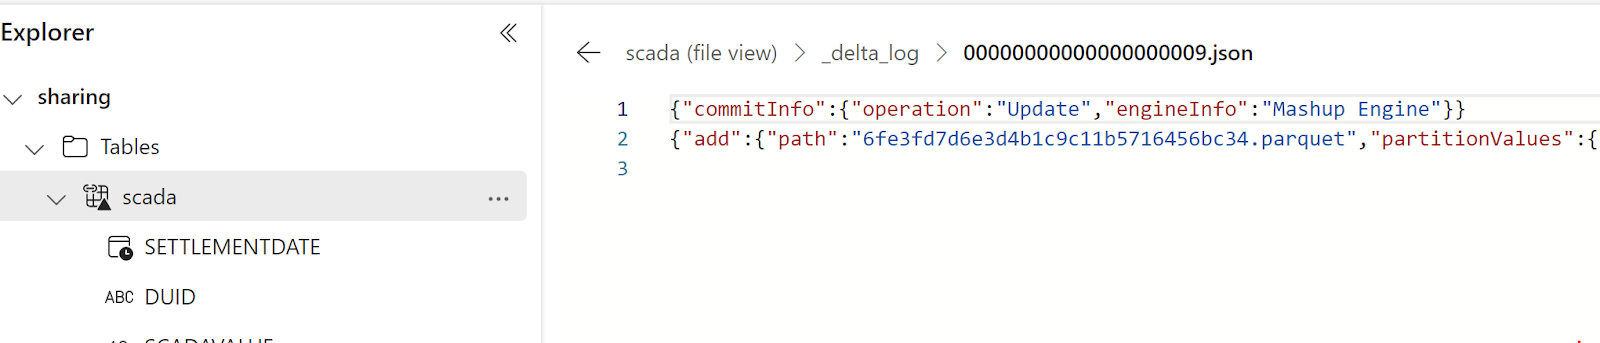
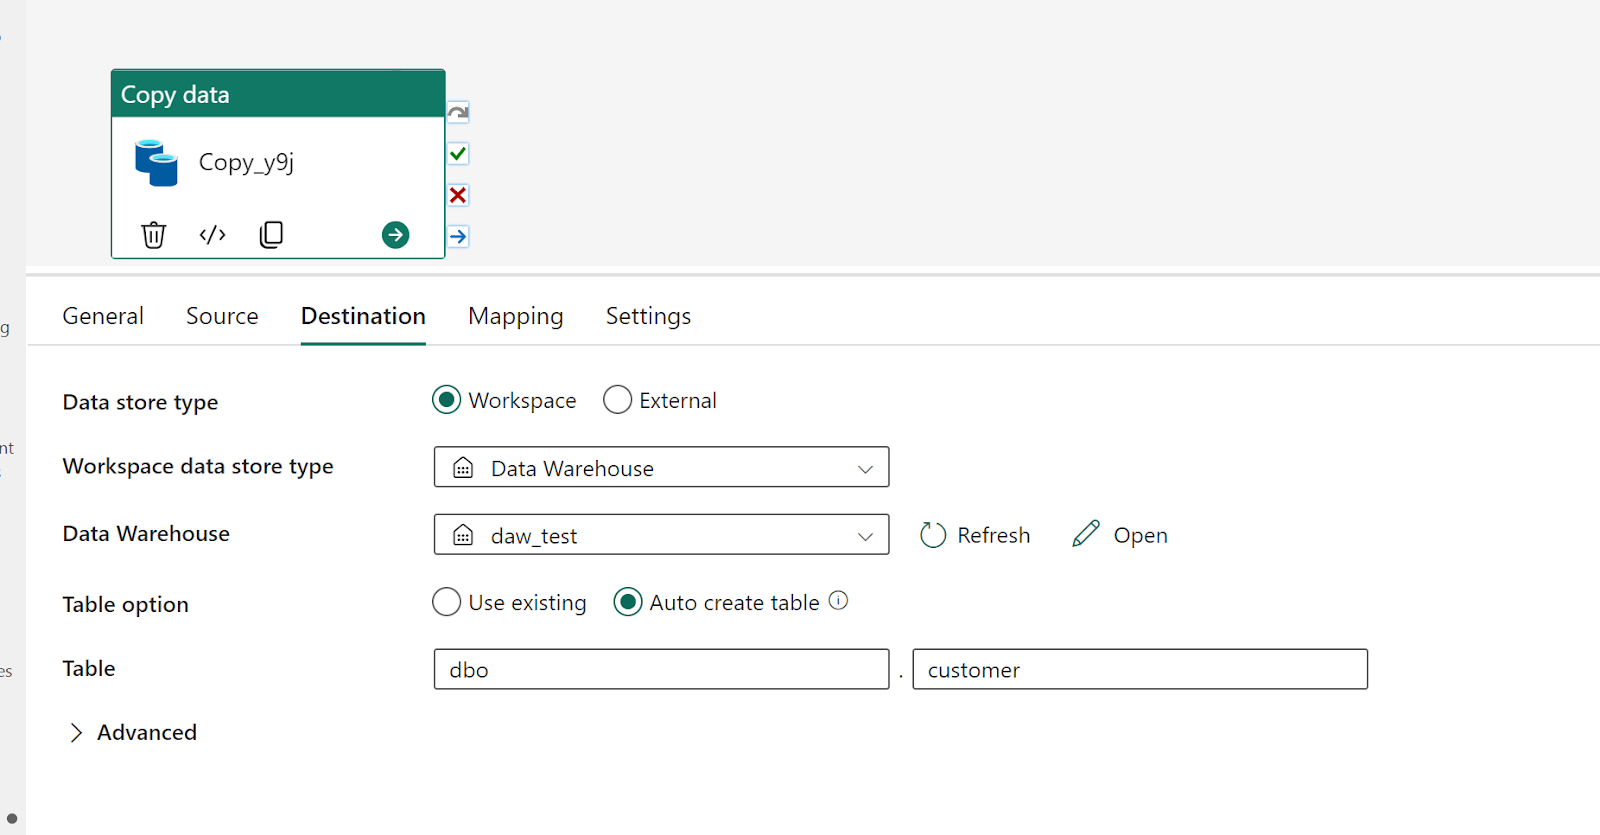
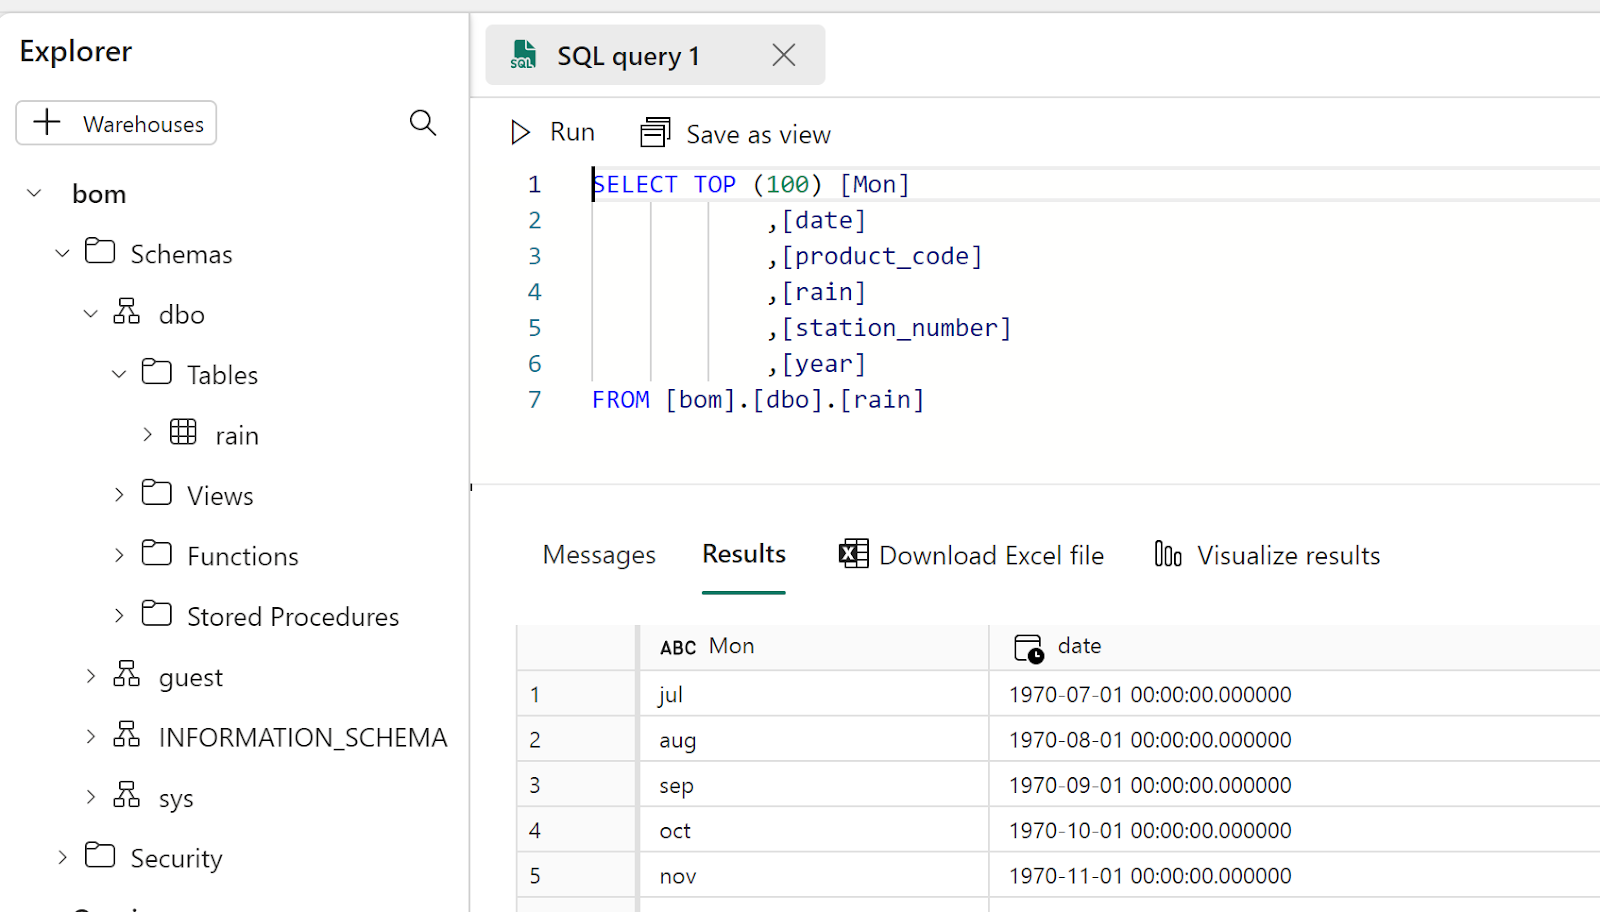
Write the final results as a Delta Table
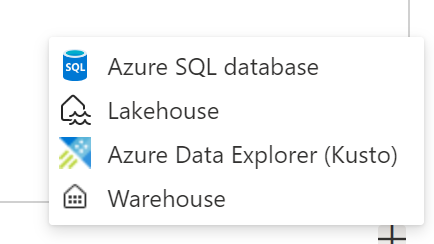
That’s pretty much the core idea of fabric, if you write your Data into Delta Table then it will be usable by all the Engines, PowerBI, SQL DWH etc
Final Thoughts
The workflow did make sense to me, the only annoying thing is when you import a new notebook in a Fabric workspace it will not overwrite the existing one but create a copy, having the option will be nice.
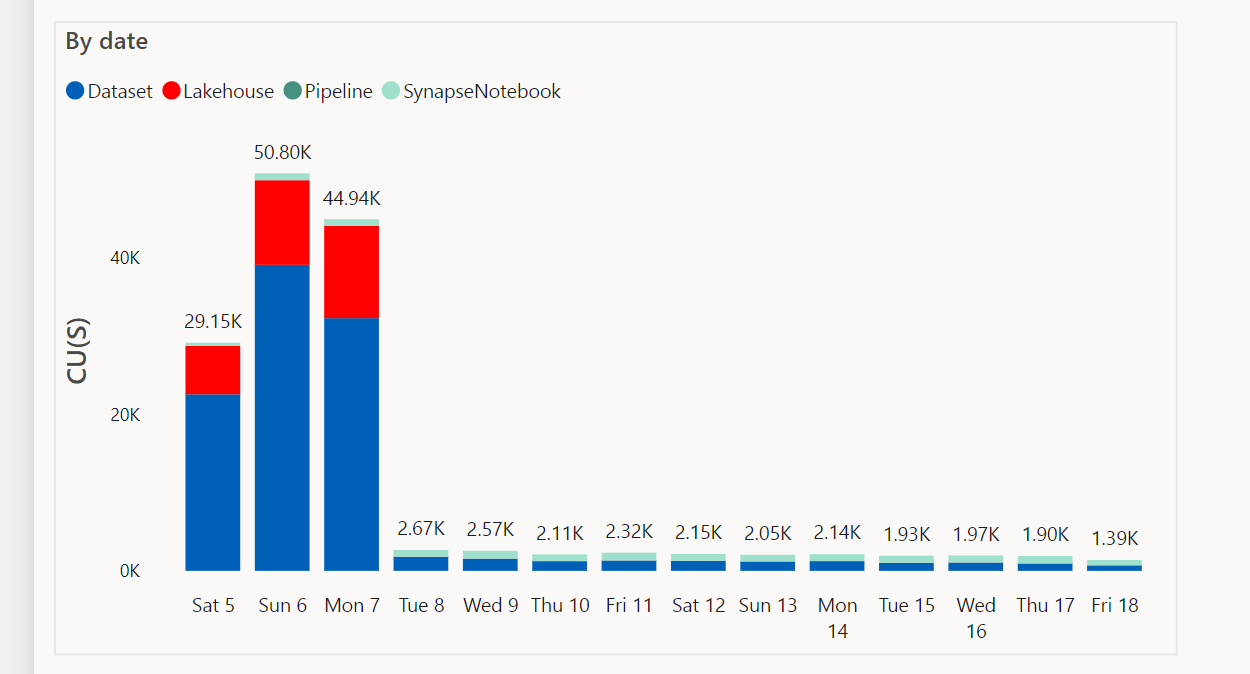
I can see some advantages for this approach, like if you have a very small SKU and you want to optimize the resource usage, using your laptop for developpement can save you some precious compute, another case maybe if you were not given access to fabric from the admin, showing you have already a working code and you know what you are doing can make the conversation easier.
One thing for sure, users will use fabric in some unexpected ways and that’s just fine.