At last in the August 2021 update of PowerBI we finally can create custom Queries when connecting to BigQuery, this is a very big deal for two reasons.
For users who can’t write views on the Database
Passing complex parameter values to a SQL Query
To show an example, I am using the same Query from this previous blog, I am not going going to repeated here, have a look as it has more details about BigQuery GIS Clustering.
First issue I did not know how to pass multiple values, as it is a list, luckily Chris has written this excellent blog using Snowflake please read his blog first, and the code works the same
Here is the a pseudo M code, notice I copied Chris code verbatim, I had just to add Square Brackets “[]” to the parameter TagsList , so BigQuery understand it as an array.
let
TagsList =
    if
    //check to see if the parameter is a list
      Type.Is(
        Value.Type(tag_selection),
        List.Type
      ) then
        //if it is a list
        let
          //add single quotes around each value in the list
          AddSingleQuotes = List.Transform(
              tag_selection,
              each "'" & _ & "'"
            ),
          //then turn it into a comma-delimited list
          DelimitedList = "[" & Text.Combine(
              AddSingleQuotes,
              ","
            ) &"]"

        in
          DelimitedList
    else
      //if the parameter isn't a list
      //just add single quotes around the parameter value
      "['" & tag_selection & "']",

Source = Value.NativeQuery(GoogleBigQuery.Database([BillingProject="xxxxxx"]){[Name="test-187010"]}[Data], "select  from xxx WHERE    value IN UNNEST( "& TagsList &"  ))
    Source
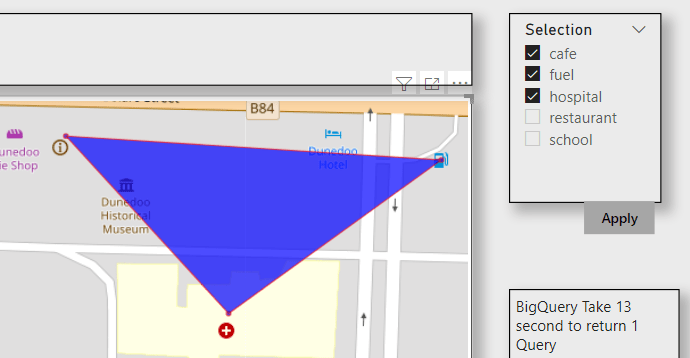
and here is the final report, using the Excellent icon Map custom Visual
As the data is free, I made a publish to web report , the report is a bit slow as it take in average 12 second for BigQuery to return the results, either GIS Clustering is expensive or The SQL Query is not optimized.
I think it is an exciting new functionality, there are a lot of uses cases where you want to exactly control the SQL generated by PowerBI.
I was reading this blog post and thought of a new use case, using OpenstreetMap Data and generate polygons based on the user Selection
First to reduce cost, we will select only all a subset of OpenstreetMap Data, you can use this post as a reference
my base table is OPENSTREETMAPAUSTRALIAPOINTS , which contains 614,111 rows
The idea is to provide some tag selection ( School, cafe etc) and let BigQuery generate a new polygons on the fly, the key function in this SQL script is ST_CLUSTERDBSCAN
WITH
  z AS (
  SELECT
    *
  FROM
    `test-187010.GIS.OPENSTREETMAPAUSTRALIAPOINTS`
  WHERE
    value IN UNNEST(@tags_selection)),
  points AS (
  SELECT
    st_geogpoint(x,
      y) AS geo_point,
    value AS type
  FROM
    z ),
  points_clustered AS (
  SELECT
    geo_point,
    type,
    st_clusterdbscan(geo_point,
      200,
      @ct) OVER() AS cluster_num
  FROM
    points),
  selection AS (
  SELECT
    cluster_num AS spot,
    COUNT(DISTINCT(type))
  FROM
    points_clustered
  WHERE
    cluster_num IS NOT NULL
  GROUP BY
    1
  HAVING
    COUNT(DISTINCT(type))>=@ct
  ORDER BY
    cluster_num)
SELECT
  spot AS Cluster,
  st_convexhull(st_union_agg(geo_point)) as geo_point,
  "Cluster" as type
FROM
  selection
LEFT JOIN
  points_clustered
ON
  selection.spot=points_clustered.cluster_num
  group by 1
union all
SELECT
  spot AS Cluster,
  geo_point ,
type
FROM
  selection
LEFT JOIN
  points_clustered
ON
  selection.spot=points_clustered.cluster_num
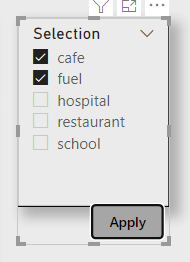
Technically you can hardcode the values for Tags, but the whole point is to have a dynamic selection
I am using Data Studio and because the Query is not accelerated by BI Engine , and in order to reduce the cost, I made only 6 Tags available for user selection and hard code the distance between two points to 200 m.
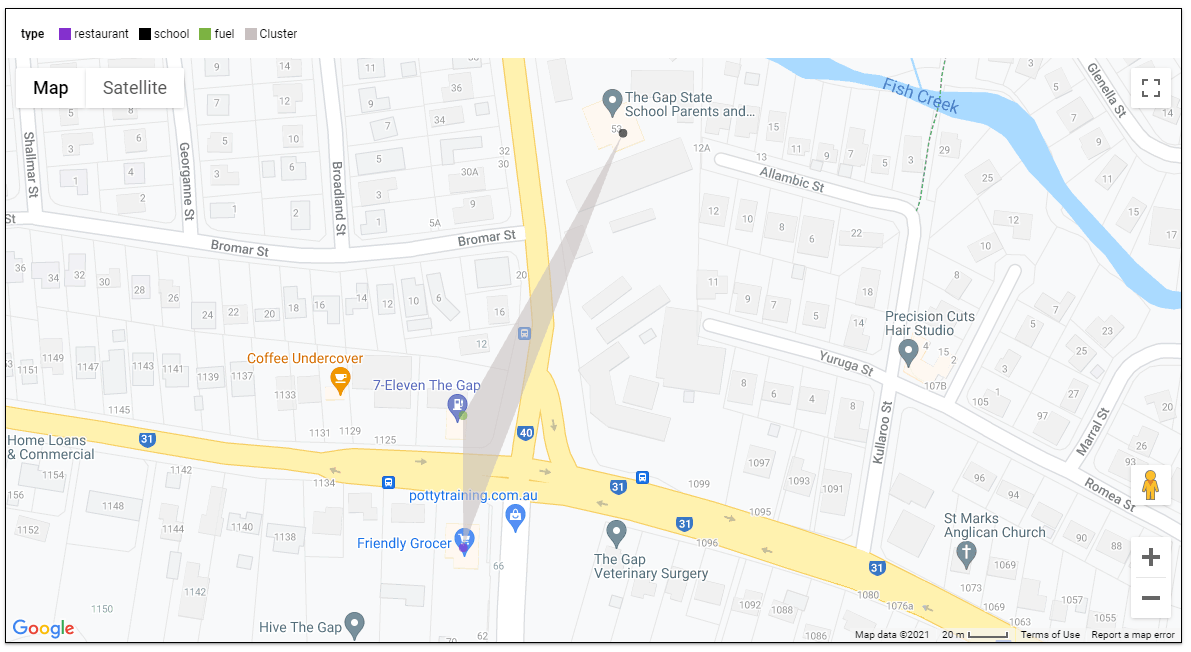
Here is an example when selecting the tags (restaurant, school and fuel), I get 136 cluster
here when I zoom on 1 location, the result are pretty accurate
I think it is a good use case for parameters, GIS calculation are extremely heavy and sometimes all you need from a BI tool is to send Parameter values to a Database and get back the result.
was listening to this Excellent Podcast about Minerva, basically Airbnb went and built a Metrics Store which is a central tool that hold all Measures and dimensions, the idea is to have one source of truth.
The Podcast is very insightful and worth listening to, But I was very surprised that none of the participants mentioned how existent BI vendors tried to solve the same Problem ,they talked Quickly about LookML but as far as I know it is not available yet for third party tools
Metrics Store is not new, it is just another name for Semantic Model, Business Objects had one from 30 years ago.
So Just for fun, and I am not sure if it is even practical, I wanted to test if PowerBI can act like a pure Metrics Store for third party tools.
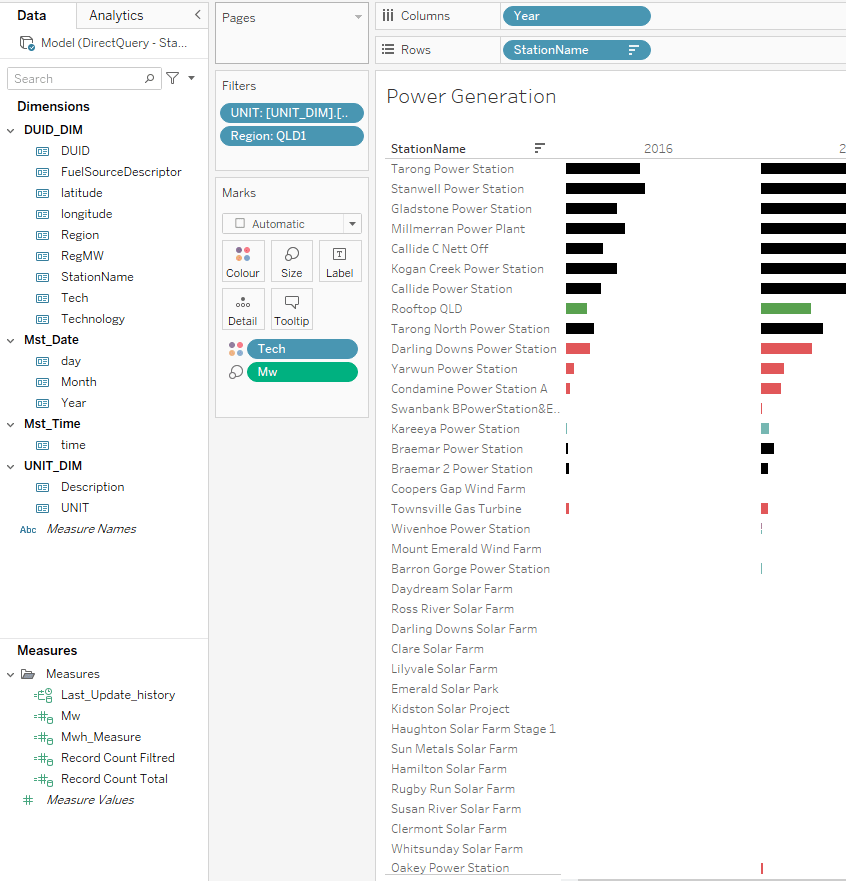
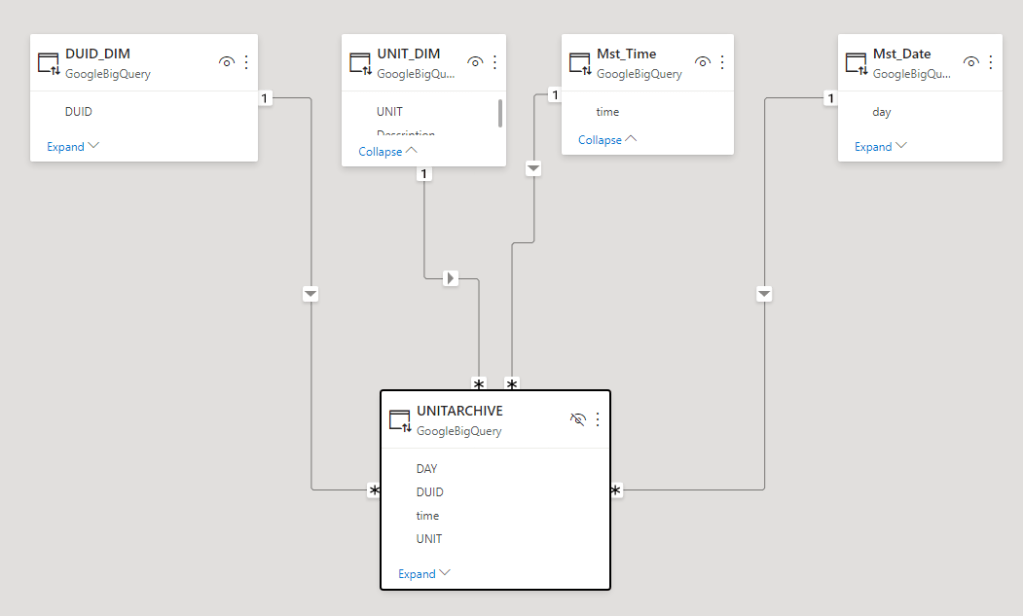
I am using BigQuery as a data source, 1 fact table 80 Million records and 5 dimension Tables all using Direct Query Mode, PowerBI is not holding any data, all it does , it receive Queries from the Viz tool in this case Excel and Tableau and translated it to SQL and serve the results back.
I publish the Model to PowerBI service, here is the catch it has to be Premium workspace, Premium per user works too
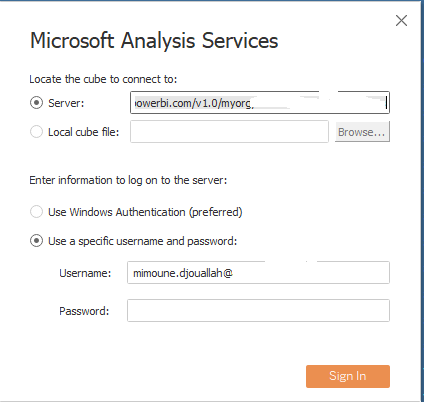
now Using Tableau, I connect to SSAS, I get the server address from Workspace setting, notice PowerBI and SSAS are using the same engine.
and Voila Tableau Indeed Work just fine
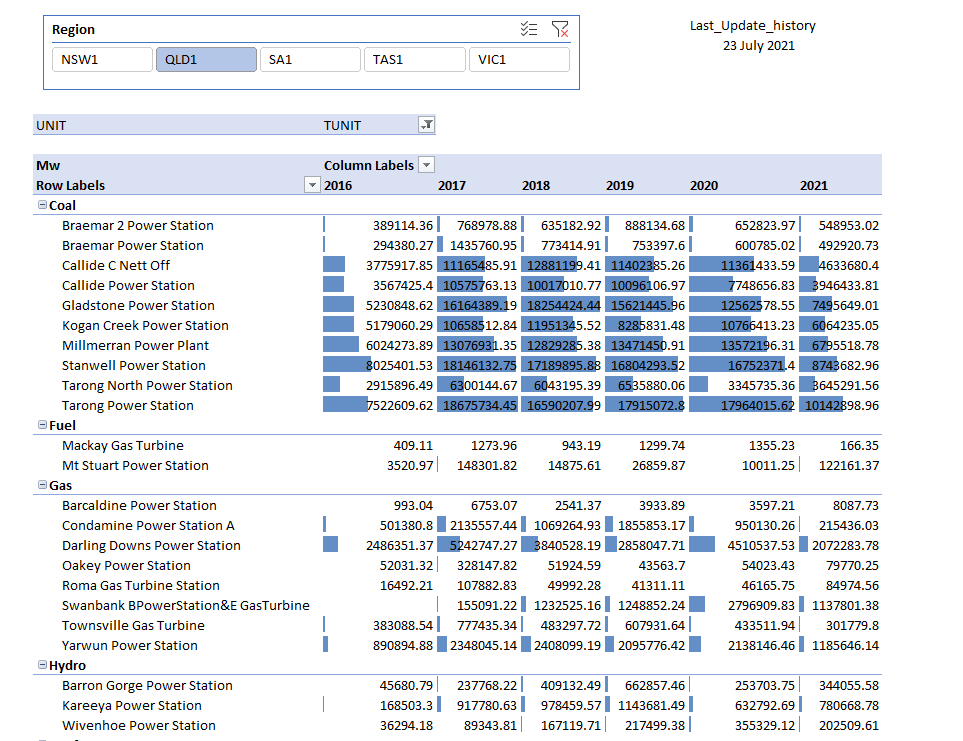
now trying Excel
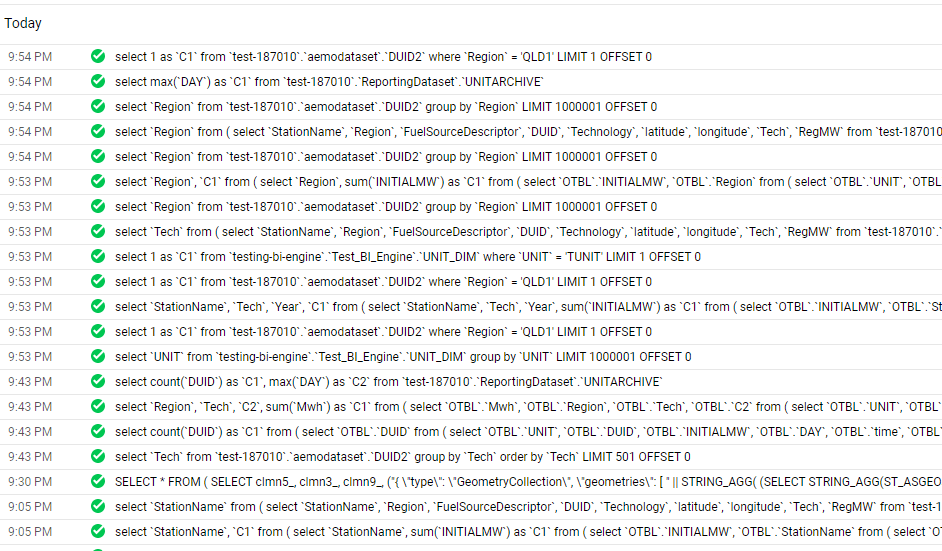
and here the SQL Queries generated by PowerBI
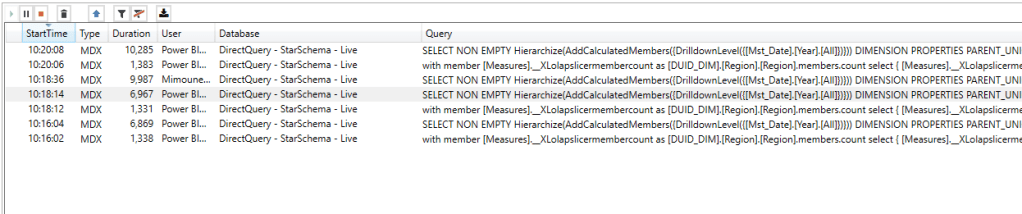
Notice here Tableau/Excel talk to PBI Semantic Model using MDX, which you can see here using DAX Studio where I can capture all the Queries coming to PBI
The Performance is not great but tolerable I guess, MDX Queries render from 6 to 10 seconds, But it did work which is rather amazing by itself 🙂
Metrics Store is an interesting idea on paper, but not sure in practice, it is hard to justify paying for multiple tools, if you build your semantic Model in one tool, why pay for another BI tool ? The Other challenge is self service Scenario, the user needs to be able to add extra Measures and Dimensions.
and for new vendors, it will be helpful to explain what kind of problems they are trying to solve that the existing tools couldn’t, just creating a new fancy name is not good enough.
Looker was always a bit of mystery for me, as there was no trial version to test, and they have high profile customers, luckily Google recently start providing trial version without asking too much Questions, I registered 2 months ago, and recently got an email with a trial offer.
it is just an impression, I just used it a couple of times in the weekend with no training
You get an URL instance with the name of your company, I used a dummy name.
The user interface is rather streamlined, nothing unusual which a good thing , as expected it is hosted in Google Cloud, but you can’t see anything from the console ( Looker is available in AWS, Azure and GCP)
Looker by default has two modes, development and production, everything you build is linked to Git repository
let’s say you want to build a new Dashboard , first thing to do is to create a new LookML Project, setting up GitHub was straightforward, I made the repo public
Probably you are asking where is the data preparation the Likes of PowerQuery or Tableau Dataprep, there is none, Looker connect only to Databases, it assume you have already a Data Warehouse, Looker Provide Just the Semantic Model using LookML code and the Viz, and the API which you can call from any Clients.
There is no Import mode, all connections are live, there is a cache though that save the result caches which you can adjust by Project or you can turn it off by using cache = 0 second.
There are aggregation Table , which you can use to speed up Queries but again you need to store them in the source database.
Looker use an internal Database ( I think MySQL), but is only to store internal Metadata ( users names, SQL Queries etc), all calculation depends on the source system
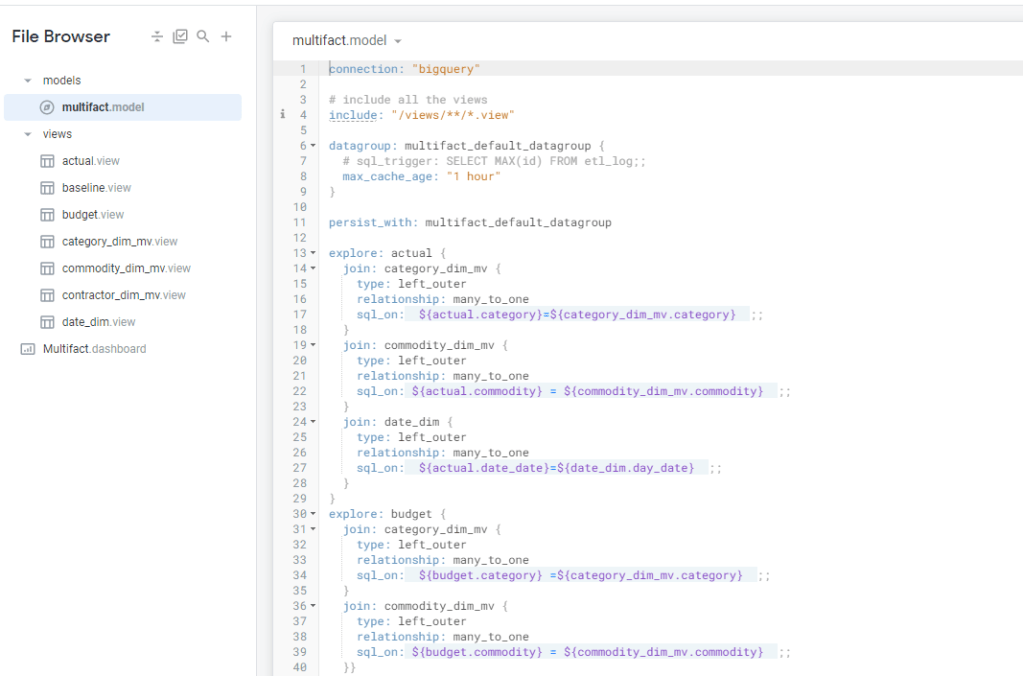
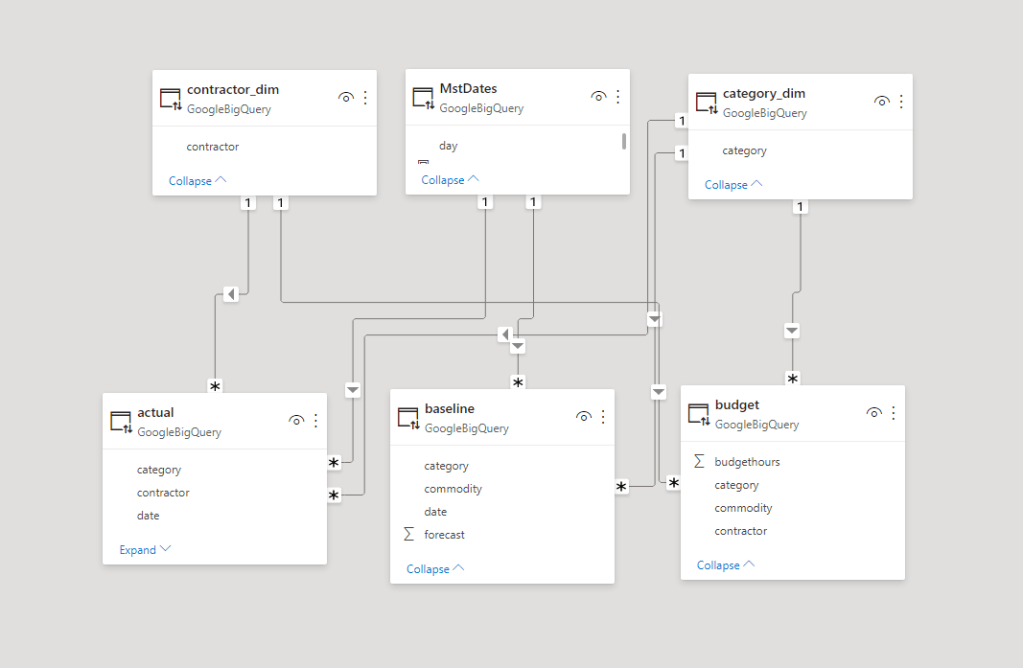
To my surprise at least for simple Semantic Models, LookML is not too hard, I connected to a dataset in BigQuery and Looker imported the Table Schema, all I had to do is to define relationship between Tables, and add Measures using SQL
funnily enough the most confusing Part; Looker does not use standard technical Terms:
Views means Table
Explore is a semantic Model
Model is a group of Explores and Views
Look is a chart
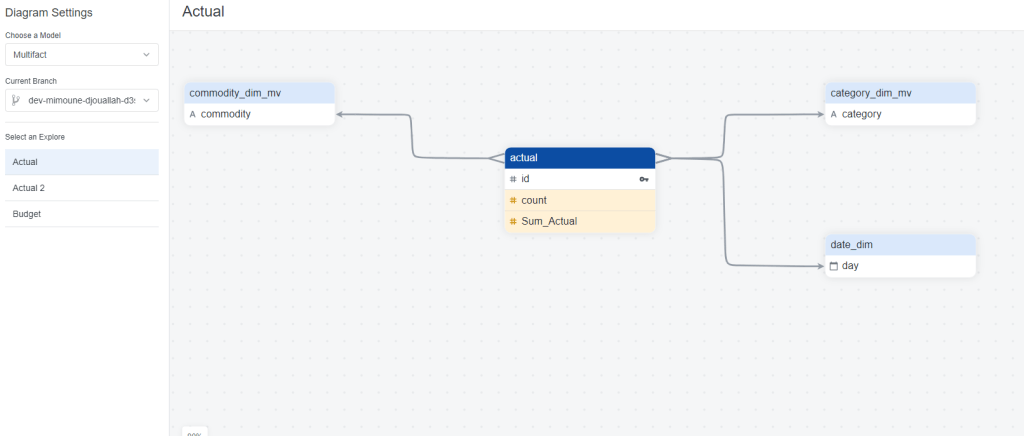
at any time you can View the Diagram View
One interesting aspect of Looker Modeling compared to PowerBI, you can have Multiple Models that join the same tables in different ways !!! but at the same time, I could not reproduce a typical Multi Fact Tables easily (Example from PowerBI, I am not saying it is not possible, but I did not know how to do it)
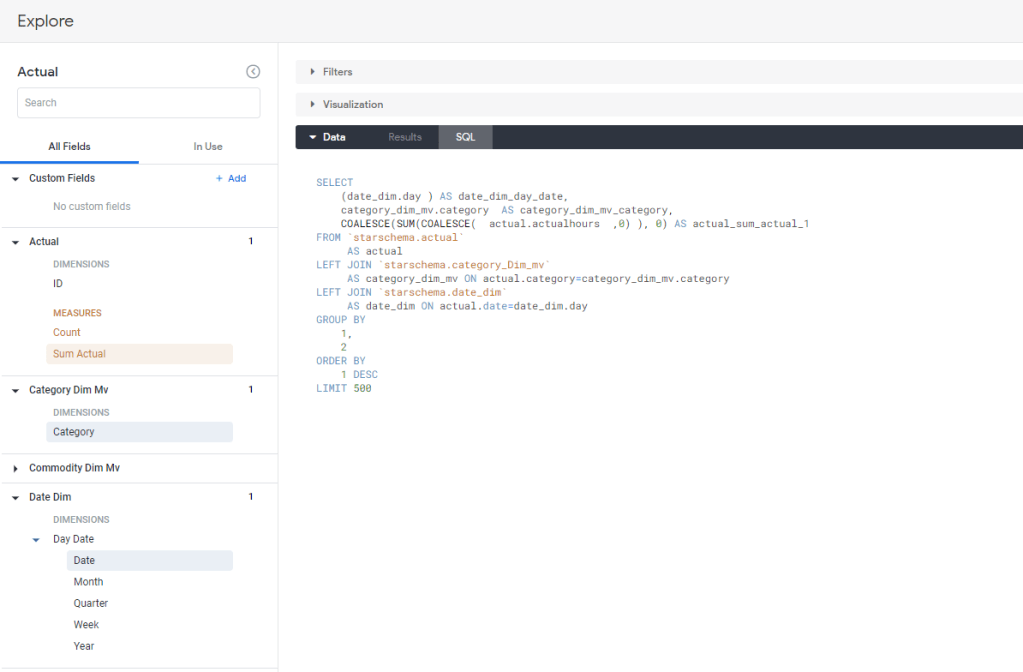
Once the Model is completed you can start exploration using “Explore”, I guess this is the core Concept of Looker , every time you add a metric and dimension, Looker automatically generate the Correct SQL, and because the Model are defined Enterprise wide , the metric definitions and dimensions are consistent regardless of the users.
Notice here, the first thing you get is the data in a tabular Form, then you define the Visual, there is a saying that PowerBI is 80 % Data and 20 % Viz, I would say Looker is 99 % Data and 1 % Viz :), OK I am a bit exaggerating but don’t expect a Tableau Level Customization
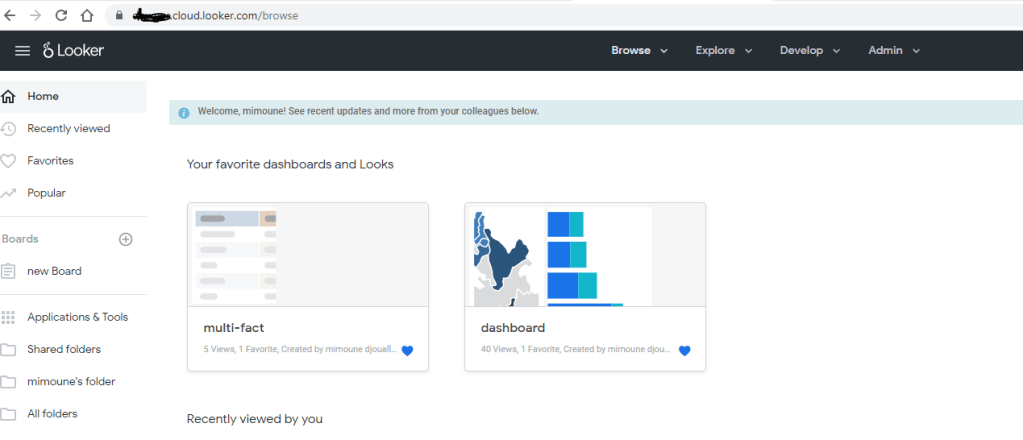
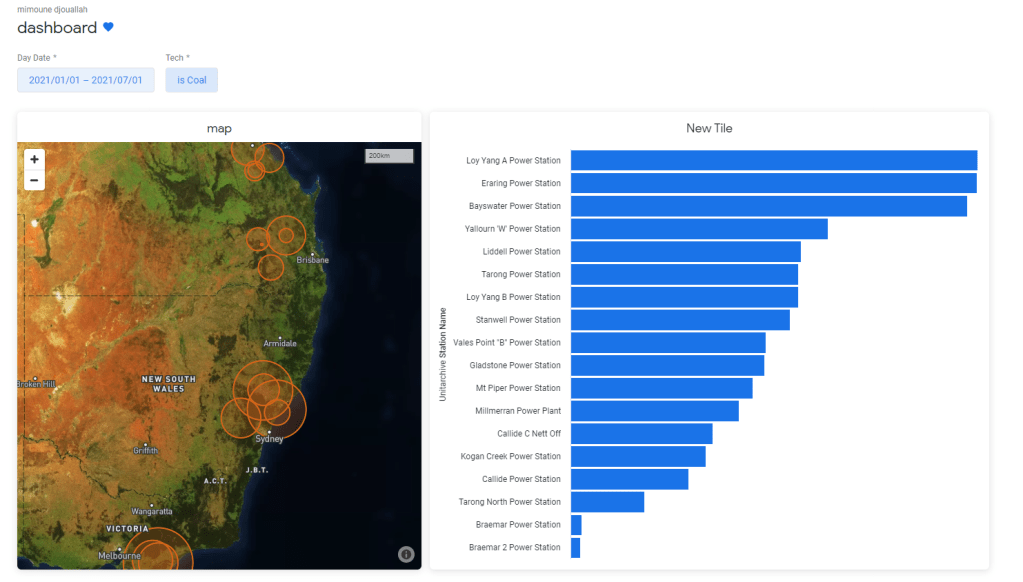
When you are happy with your explore you can save it as a Look which is basically an individual Chart which you can pin to a Dashboard like this one
Another very nice functionality is Roles, in PowerBI you can customize what a user can do , build new content, sharing etc, But in Looker it is very granular, you can customize any option , you can even authorize who can and can’t download data !!
Sharing is very trivial, you can share with external users with different email address, even users with gmail and hotmail.
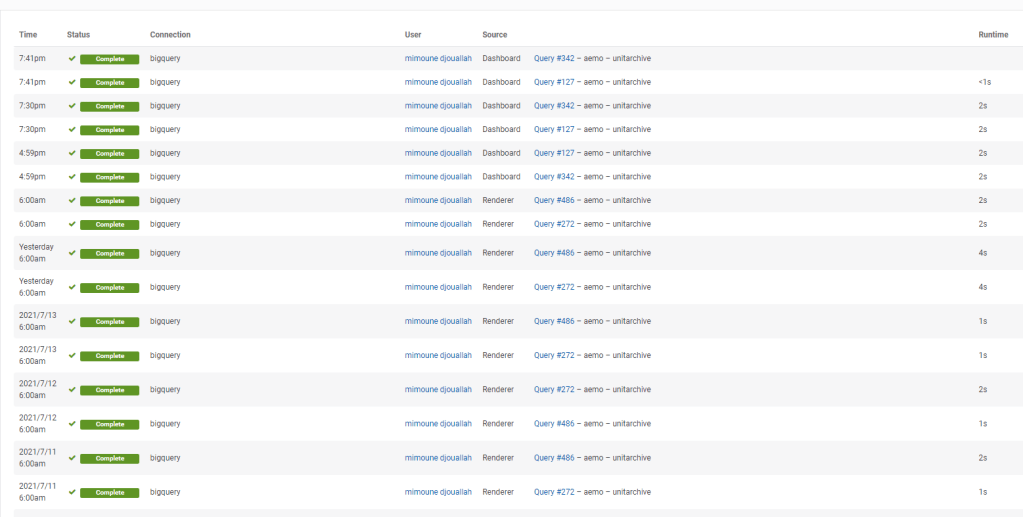
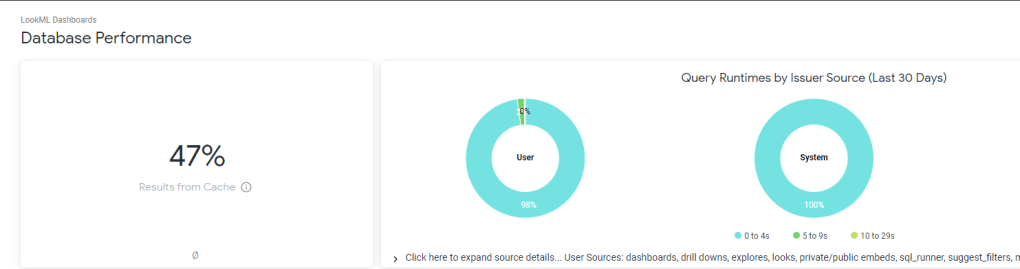
Tracking performance is simple, you can see the history of all SQL Queries and identify any issues
and a nice overall Performance of your Instance
Regarding Performance, I think Looker will perform Better compared to PowerBI in Direct Query mode , simply because there is less moving parts, in PowerBI, the viz generate a DAX Query against the Model which call the engine which call PowerQuery that convert to SQL, Looker Just Generate SQL Queries based on the Data Model that’s all
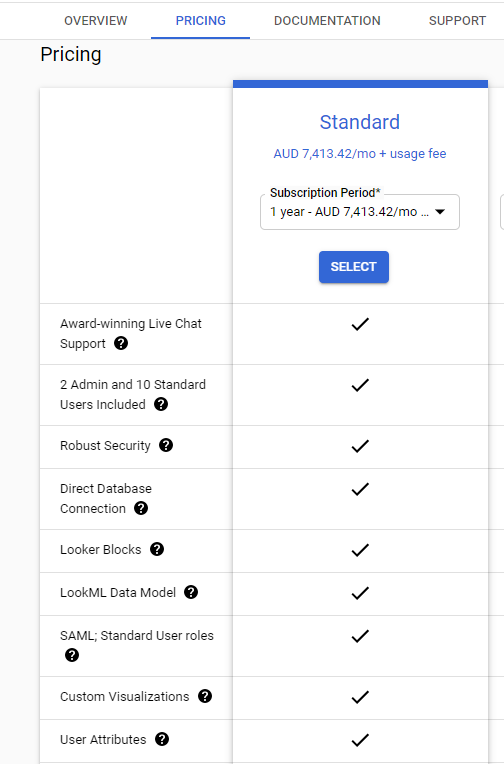
You can’t really Talk about Looker without talking pricing, here is a screenshot from Google Cloud Pricing
yes, there is no typo, 5000 $/Month get you 12 users and you need to pay 30 $/Month for any extra user !!!
apparently Looker is very popular with High scale embedded scenarios but it require some JavaScript skills which is out of my scope.
Take Away
as Far as I can see the target Market of Looker is Large Enterprises with Mature Data infrastructure and deep pockets, I can see the attraction of code based solutions with version control and centralized Semantic Models, no wonder BI professional with Software engineering background love it.
Apparently in the short term a lot of Data is moving to the cloud and Cloud Data warehouse are getting really Fast and cheap ( See BigQuery BI Engine), the concept of Live connection using a centralized Semantic Model is very attractive and according to some industry commentators it is the next big thing in Business intelligence.
Personally I am not sold, I think every Business users should be able to build his own analysis without waiting on a central BI team( not all reports are equals, some are strategic which require governance other less ), on the bright side LookML is not as hard as I thought at least for simple Models, but with the current Pricing, it is fair to say it is not a threat to PowerBI at least for smaller Installation
edit : got a feedback that a self service user can add custom measures and dimension that did not exist in the original Model , see documentation , but still if you want to use new data, it has to be imported first in the Source Database.
edit : Google shut down my trial instance after three weeks, unfortunately I can’t write any more about Looker, if someone from google is reading this , you’re not helping yourself.