
Was doing some visualization in Fabric Python Notebook and I end up with this report, don’t worry, it is not the source table, my data is normalized, it is just a pivot table not a Delta Table.

It makes sense visually, I can easily see the numbers side by side, that’s a decent Pivot Table, there is something deeply human about seeing the raw numbers.
Note : Don’t read too much in the data itself, it is not very rigorous ( OS cache is messing everything up)
SQL Excel Style
Then I wanted to add a column to show the biggest number for every row. Yes, I know how to do it the Proper way 🙂 but why can’t I do it here without doing unpivot and stuff, after all it is trivial in Excel right ? turn out it is possible now using DuckDB SQL ( development build)
xx = duckdb.sql(f" select *, greatest(*columns(*exclude(query))) as max from result  ")
xx
Yes, that’s right, it’s looking for the highest number horizontally !!! I think it is awesome, it seems only the greatest and the least are supported so far, but I will not be surprised if they add sum and addition after all there is no natural law that dictate a sum in SQL should accept only 1 column as a parameter.
I want to normalize the numbers , the worst performance will be 1, I can do that by dividing the columns values by the the column max, again, I am doing calculations at the row, level, probably an Excel user will wonder what’s the big deal about it 🙂

I want to count the worst Query by engine, I will just count all the rows with number 1
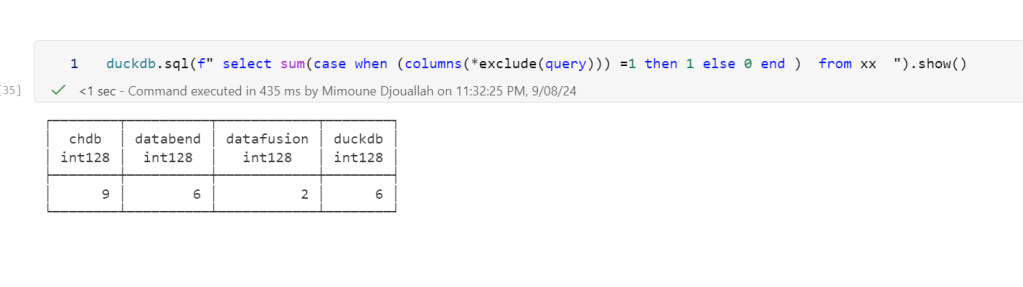
Now let’s use the original report “results” to see the total duration for all Engines

And geometric mean

Cast multiple columns in one go
This one was really helpful as I had a table with nearly 40 columns to cast to double, which is a trivial operation when using Dataframe API but a nightmare in SQL as you need to type every column name, with columns, it is trivial
cast(columns(*exclude(DUID,UNIT,SETTLEMENTDATE,I,XX,filename)) as double)Take away
As an Excel user, who try to play a bit with SQL, sometimes I ask myself, surely there must be a better way, why SQL can’t do this or that easily ? and I remember asking the same question to an industry veteran a couple of years ago and his answer was basically the current status quo is the natural order of things and you should try a Dataframe API for that, but now I know it is not true, SQL can do anything in theory, no one has bothered to do the hard work, I had the same reaction when I “discovered” TSQL where it acts literally as a programming language with loops and if then !!!
Having said that, i feel the industry has more appetite for a change, notice for example how quickly DWH vendors adopted group by all, maybe it is more practical to enhance SQL than hope for the adoption of a standard DataFrame API ?
and by the way, if you want to do analysis using SQL do yourself a favor and use a notebook 🙂
