Edit : How many physical cores a service is using is considered an internal implementation, for example Snowflake don’t publish those numbers nor BigQuery, Redshift etc, for a simple reason those numbers may change when the vendor upgrade their compute layer, I am not asking for this information, I am mainly talking about the compute unit ( CU), which is a virtual unit like BigQuery Slot, today we don’t have this information for a lot of items, as a customer, I don’t think it is too much asking.
Introduction
One very confusing aspect of Fabric preview is that the usage pricing is not public yet, early adopters get confused when people ask for pricing, their reply, the pricing is public and they show this blog post with the pricing table

The table shows you only the price for Every SKU and how much compute you will get, but it does not tell which size to use to support your workload, nor what’s the performance of the different Engines in Fabric
Just do a POC and see how it goes
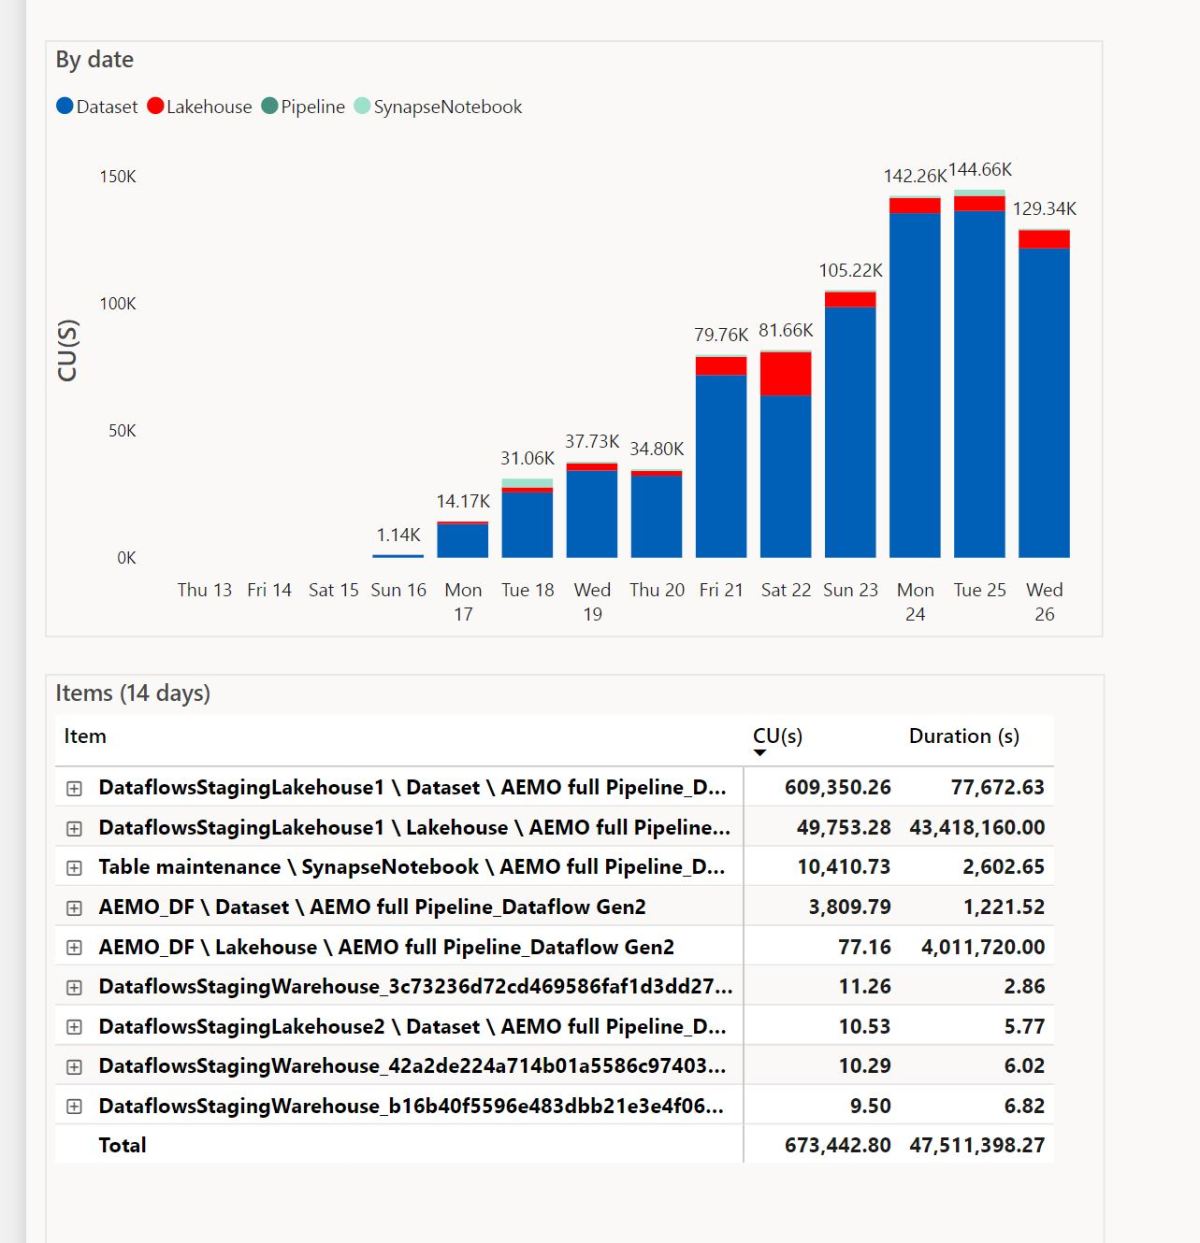
It is free in Preview, just do a POC and attach a free trial capacity, that’s a good way to learn how the system works, but today, it does not tell you how much compute it is using as the Workload for DWH and Dataflow Gen2 is not reported, for example, I built a full end to end report in Fabric using Dataflow Gen2, OneLake and Direct Lake mode in PowerBI

It was a good exercise, I definitely learnt new skills, but I have no idea how much compute unit (CU) this solution will consume from my capacity, what’s reported here is only some items that show their usage data but not dataflow Gen2 ( some items like the default dataset should show 0 but that’s a bug, it is a preview after all)
Spark is the Good Guy 🙂
Spark Engine do report the usage from day 1, what you see is what you will get in the GA or even better (but not worst), same solution using Spark

I can say useful things about Spark performance because I can see the numbers, I know exactly how many compute unit (CU) it is using, I don’t have the slightest idea about Dataflow Gen2 nor Fabric DWH.
Can we Talk about Fabric Performance ?
No, today we can’t, you simply can’t say anything meaningful about the performance if you can’t see the usage numbers, for example, I ran Query 1 of TPCH_SF10 ( that’s 60 million rows), it took 1 second, that’s pretty good, is it performant though ? again I don’t know how many compute unit it is using.

What does it mean
I have mixed feeling about it, a charitable take, they are just fine tuning some numbers, another take, users can be a little bit uncomfortable that 2 months in the public preview and no indication on the pricing is a bad sign, I don’t know and I don’t think it is useful to speculate, but if you are using fabric today in preview don’t assume this is the whole story, we will get the full picture only when we see all the usage information.
And again, I am not suggesting, it is not performant, all what I am saying is, we don’t know today, the only Engine we can talk about is Spark because they are publishing their usage numbers.
